The Technical Analysis Challenge
The game
You are shown 500 daily prices of an asset (an equity). The first series is:
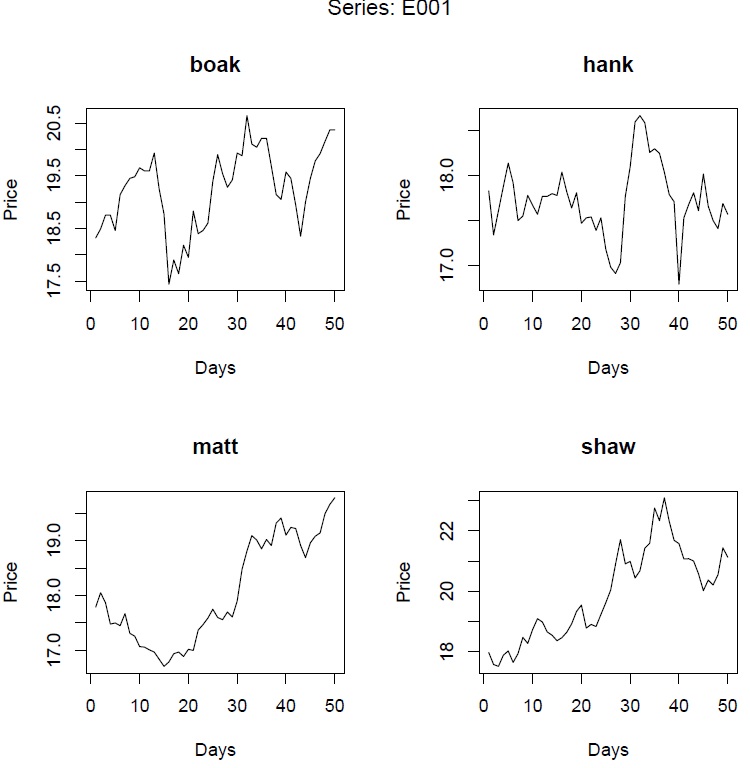
To go with this, there is a choice of four series of 50 prices each. One of the choices is the actual subsequent 50 prices; the other three choices are randomly generated. Here are the choices for the first series:
The task is to name the extension that is the actual data. There are 100 series in all.
The pictures
There are two ways you can look at the series. The first way is to have the in-sample and the extensions separate, as above:
The other way is to have the full 550 days together:
The answers
You can check your answers with:
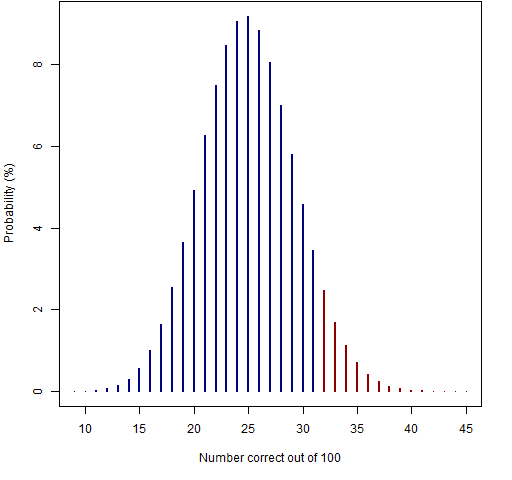
If you answer all 100 questions, then the picture shows the probabilities assuming pure guessing.
You need to answer at least 32 correct in order to have a p-value less than 5% for the test of being better than guessing.
You may not want to answer all the questions because some of the choices look very similar. The R command to get the p-value is:
1 - pbinom(number.correct, number.answered, p=.25)
For example if you answer 50 questions, then you need at least 18 correct to have the p-value less than 5%:
> 1 - pbinom(17, 50, p=.25)
[1] 0.05512336
History
This test was done without the answers being available. The challenge ran from 2003 September 6 to 2003 October 4. The working paper “The Technical Analysis Challenge” reports the results.
Data
You can get the actual data from:
- in-sample data, comma separated with each series in a column
- extensions, comma separated with each extension in a row


