Archive for category: R language

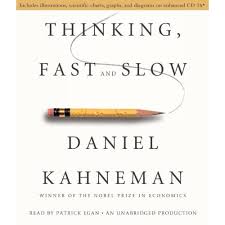
A statistical review of ‘Thinking, Fast and Slow’ by Daniel Kahneman

11 Nov 2013
2013/11/11

I failed to find Kahneman’s book in the economics section of the bookshop, so I had to ask where it was.  “Oh, that’s in the psychology section.”  It should have also been in the statistics section.

He states that his collaboration with Amos Tversky started with the question: Are humans good intuitive statisticians?

thinking_fast_slow

The wrong brain

Read more →

Translating between R and SQL: the basics

08 Nov 2013
2013/11/08

An introductory comparison of using the two languages.

Background

R was made especially for data analysis and graphics.  SQL was made especially for databases.  They are allies.

The data structure in R that most closely matches a SQL table is a data frame.  The terms rows and columns are used in both. Read more →

The joy of data analysis

24 Oct 2013
2013/10/24

Music and snow.

Poke my eyes out

Perhaps your immediate response is: “I’d rather poke my eyes out with a burning stick than do data analysis.”

There’s a completely different reaction from a lot of people who have experienced data analysis.

Music

It’s not entirely clear why humans like music so much. Part of it may be the guessing game we do.  We perceive a pattern in the music and guess where it will go next.  One of two things happens:

  • we are gratified to be right
  • we are surprised to be wrong

Read more →

A first step towards R from spreadsheets

16 Oct 2013
2013/10/16

Move your data analysis to a computing environment specifically designed for it.

Why R and not spreadsheets?

Here are three reasons:

  • complexity
  • graphics
  • money

Spreadsheets are easily overwhelmed.  Very complex things can be done in spreadsheets — it is just that complex spreadsheets are inefficient and dangerous.

Graphics should be considered vital when doing anything with data.  R has amazing graphical capabilities. Read more →

An R debugging example

21 May 2013
2013/05/21

The steps taken to fix an R problem.

Task

To prepare for the Portfolio Probe blog post called “Implied alpha and minimum variance”, I tried to update a matrix of daily stock prices using a function I had written for the purpose.

Error

When I tried to do what I wanted, I got:

> univclose130518 <- pp.updateclose(jjuc[,1:5])
done with: MMM  ABT  ANF  ACE  ACN  
Error in if (beg > end) stop("Start date must be before end date.") : 
  missing value where TRUE/FALSE needed

Read more →

Living it up with computational errors

13 May 2013
2013/05/13

How to have a better chance of a good outcome.

Making mistakes

There’s been a lot of talk recently about data analysis problems with spreadsheets.  If you’ve not stuck your head out of your cave lately, then you can catch some of the discussion by doing an internet search for:

Reinhart Rogoff

Read more →

Interview with a forced convert from Matlab to R

17 Apr 2013
2013/04/17

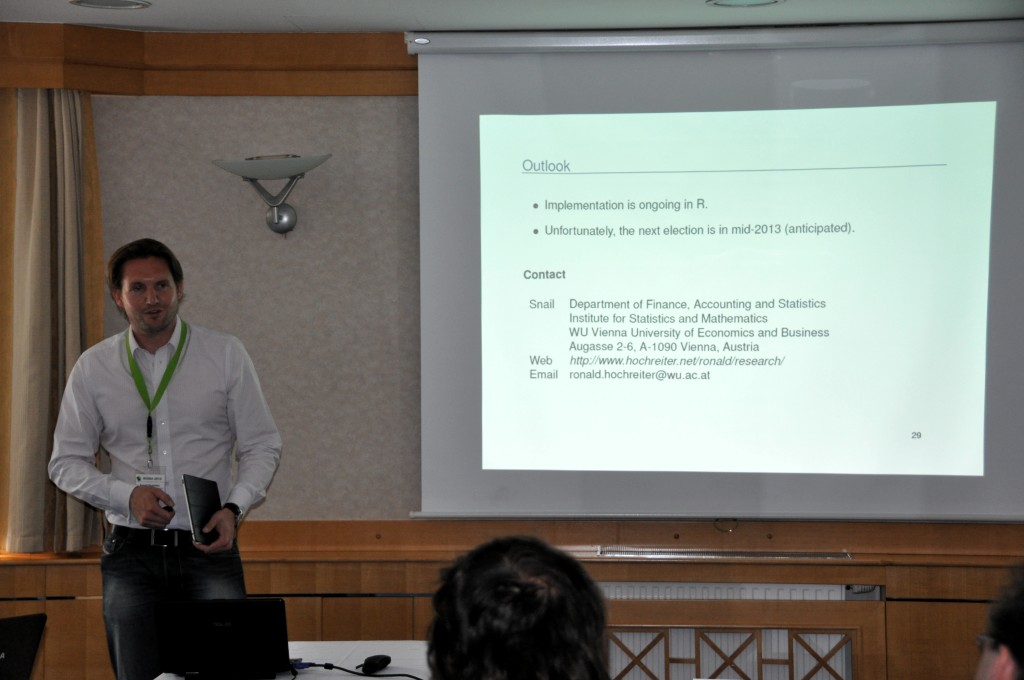
Here is an interview with Ron Hochreiter, Assistant Professor at WU Vienna University Economics and Business.

bioma1a

In 25 words or less tell us what you do (using German words is cheating).

I consider myself as a data scientist (teaching and research) with roots in Mathematical Programming, i.e. Optimization under Uncertainty (Stochastic Programming). Read more →

R and social media

10 Apr 2013
2013/04/10

R is a piece of software, but it is also a community.

Help community

The most visible aspect of the R community is help.  This is also the most useful to new users.  The initial sense of cooperation with R was driven mainly by people helping each other.

You don’t need to actively participate in order to benefit from the help venues — just watching can be very educational.

If you do ask a question, it is in your best interests to formulate the question well.  There are numerous places that give you hints on how to ask a question well, including Circle 9 of The R Inferno and the R posting guide.  Each venue has a slightly different culture, but the main principles are the same. Read more →

On the acceptance of R

20 Mar 2013
2013/03/20

Some history and a prediction.

Past

A discussion broke out on the R-help mailing list in January 2006 about a technical report put out by the statistical computing group at UCLA.  The report in question talked mainly about SAS, SPSS and Stata.  It talked briefly — and not especially positively — about R.  Someone accused it of damning R with faint praise.  It might not be a surprise that the R community had a somewhat higher opinion of R.

You can find that thread with a web search like:

"A comment about R" 2006

There was a mechanism of  creating official comments to the technical report.  I edited material from the thread, got some additional views privately, and added a few flourishes myself to produce: R Relative to Statistical Packages.

That was 7 years ago.  There were on the order of 600 packages on CRAN. Read more →

The options mechanism in R

02 Mar 2013
2013/03/02

Customization in R.

Basics

Several features benefit from being customizable — either because of personal taste or specifics of the environment.

The way R implements this flexibility is through the options function.  This both sets and reports options.  For example, we can see the names of the options that are set by default:

> names(options())
 [1] "add.smooth"            "browser"              
 [3] "browserNLdisabled"     "check.bounds"         
 [5] "continue"              "contrasts"            
 [7] "defaultPackages"       "demo.ask"             
 [9] "device"                "device.ask.default"   
[11] "digits"                "echo"                 
[13] "editor"                "encoding"             
[15] "example.ask"           "expressions"          
[17] "help.search.types"     "help.try.all.packages"
[19] "help_type"             "HTTPUserAgent"        
[21] "internet.info"         "keep.source"          
[23] "keep.source.pkgs"      "locatorBell"          
[25] "mailer"                "max.print"            
[27] "menu.graphics"         "na.action"            
[29] "nwarnings"             "OutDec"               
[31] "pager"                 "papersize"            
[33] "pdfviewer"             "pkgType"              
[35] "prompt"                "repos"                
[37] "scipen"                "show.coef.Pvalues"    
[39] "show.error.messages"   "show.signif.stars"    
[41] "str"                   "str.dendrogram.last"  
[43] "stringsAsFactors"      "timeout"              
[45] "ts.eps"                "ts.S.compat"          
[47] "unzip"                 "useFancyQuotes"       
[49] "verbose"               "warn"                 
[51] "warning.length"        "width"                
[53] "windowsTimeouts"

options returns a list.  Most of the options are not especially interesting — we’ll highlight a few of the most useful. Read more →

© Copyright - Burns Statistics